|
||
|
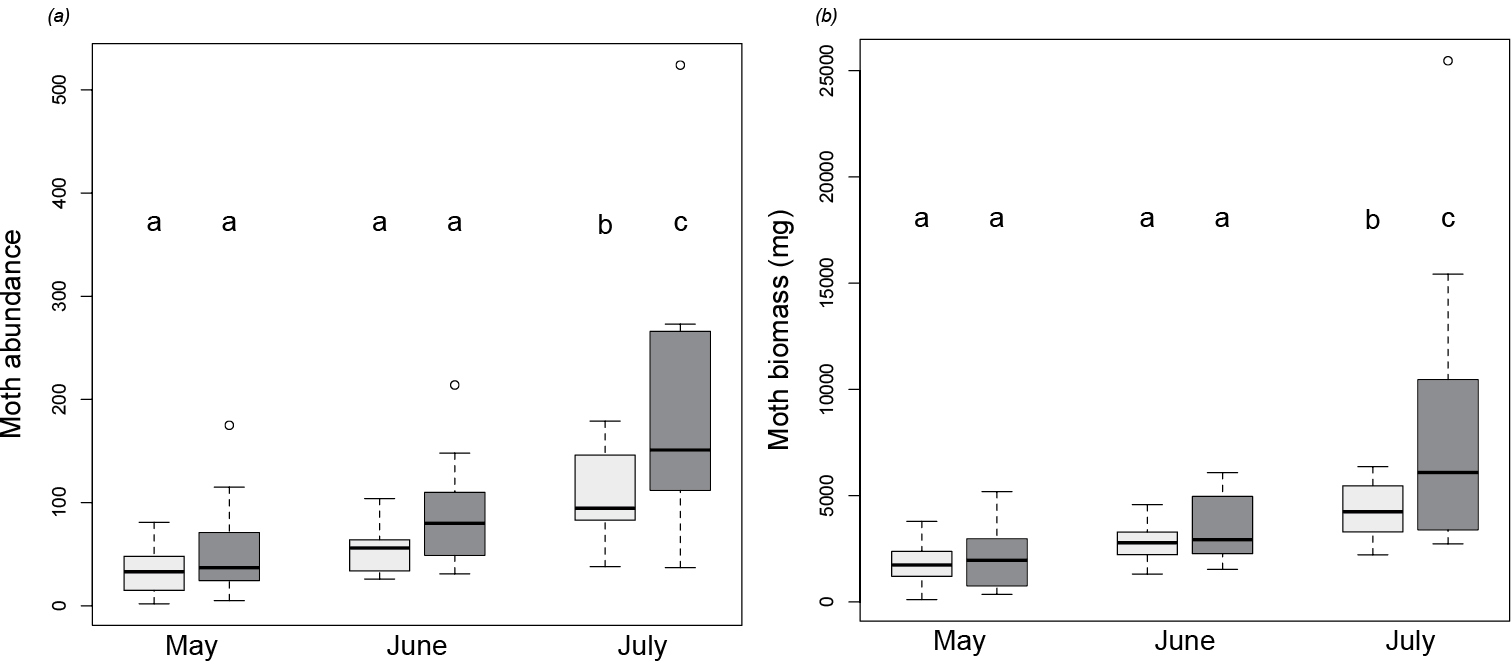
Moth abundance a and moth biomass b increased in occupied (dark grey) and abandoned sites (light grey) from May to July. The boxplots indicate the 25%, 50% (bold line) and 75% limits of moth biomass, whiskers the 10% and 90% deciles. The open dot indicates an outlier. Statistically significant differences, depicted by different letters on column tops, occurred only in July. |