|
||
|
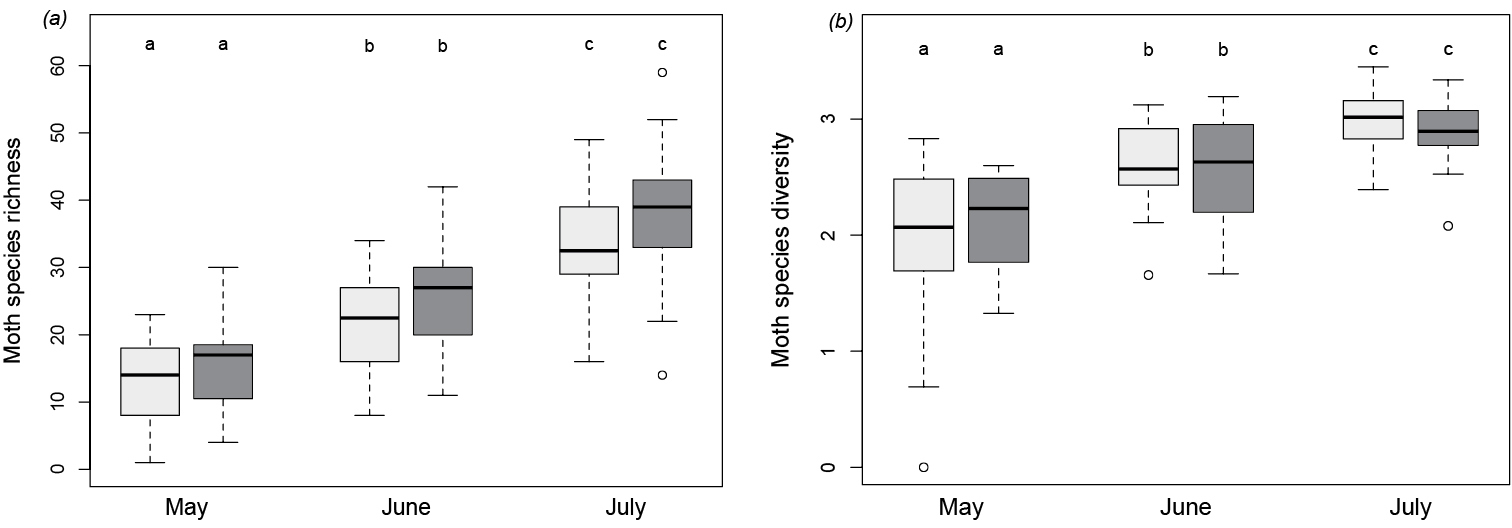
Boxplots of species richness a and species diversity b in relation to occupied (dark grey) and abandoned sites (light grey) from May to July. Boxplots visualize the 25%, 50% (bold line) and 75% limits where the whiskers indicate the 10% and 90% deciles. Open dots indicate outliers. Different letters depict statistically significant differences. |