|
||
|
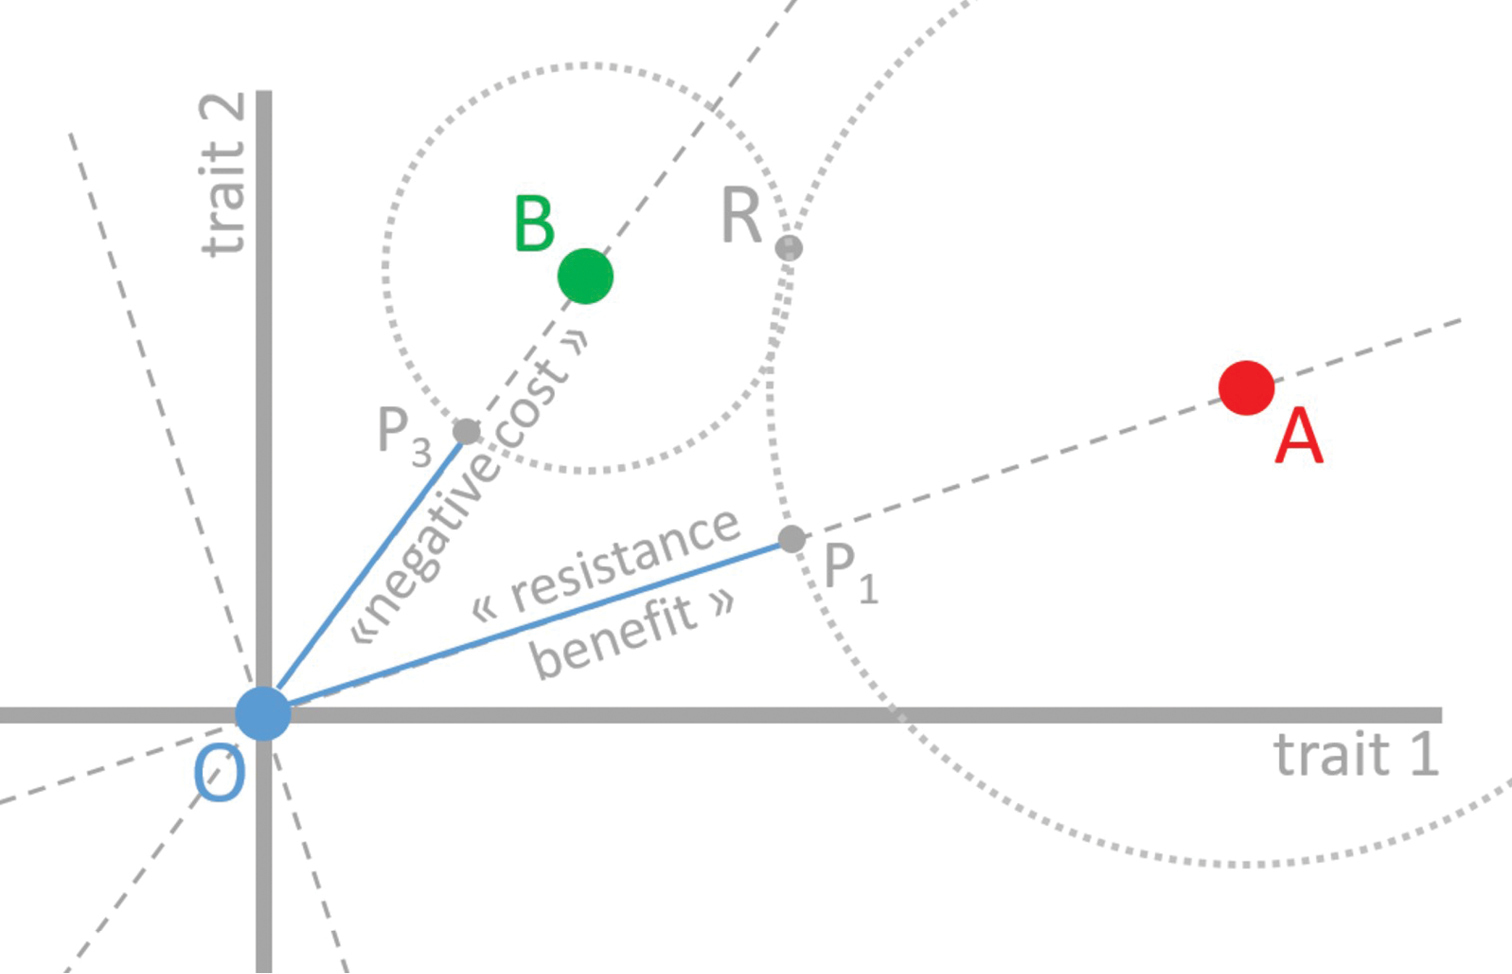
Graph of treated and non-treated environments, with distinct phenotypic requirements (phenotypic optima A and B, respectively) in a two-trait space. Relative to a wild-type positioned in O, the resistance mutation R brings the phenotype closer to A. As in Figure 1, R is therefore a beneficial mutation relative to the wild type O in the treated environment (with optimum A). However, its cost is now “negative” in the non-treated environment, as R is also closer to B compared to the wild type O. The point P3 is such that BP3 = BR. The distance to the non-treated optimum B is greater for the wild type O than for the mutant R (i.e. BR < BO). The distance difference between BR and BO corresponds to OP3. As in Figure 1, all fitness measures depend on the phenotypic distances illustrated and a mapping that could be represented as a third orthogonal axis representing fitness. This fitness axis is not shown. All phenotypes on the light grey circles have the same fitness than mutation R in the treated environment (optimum A, large circle) and non-treated environment (optimum B, small circle). |