|
||
|
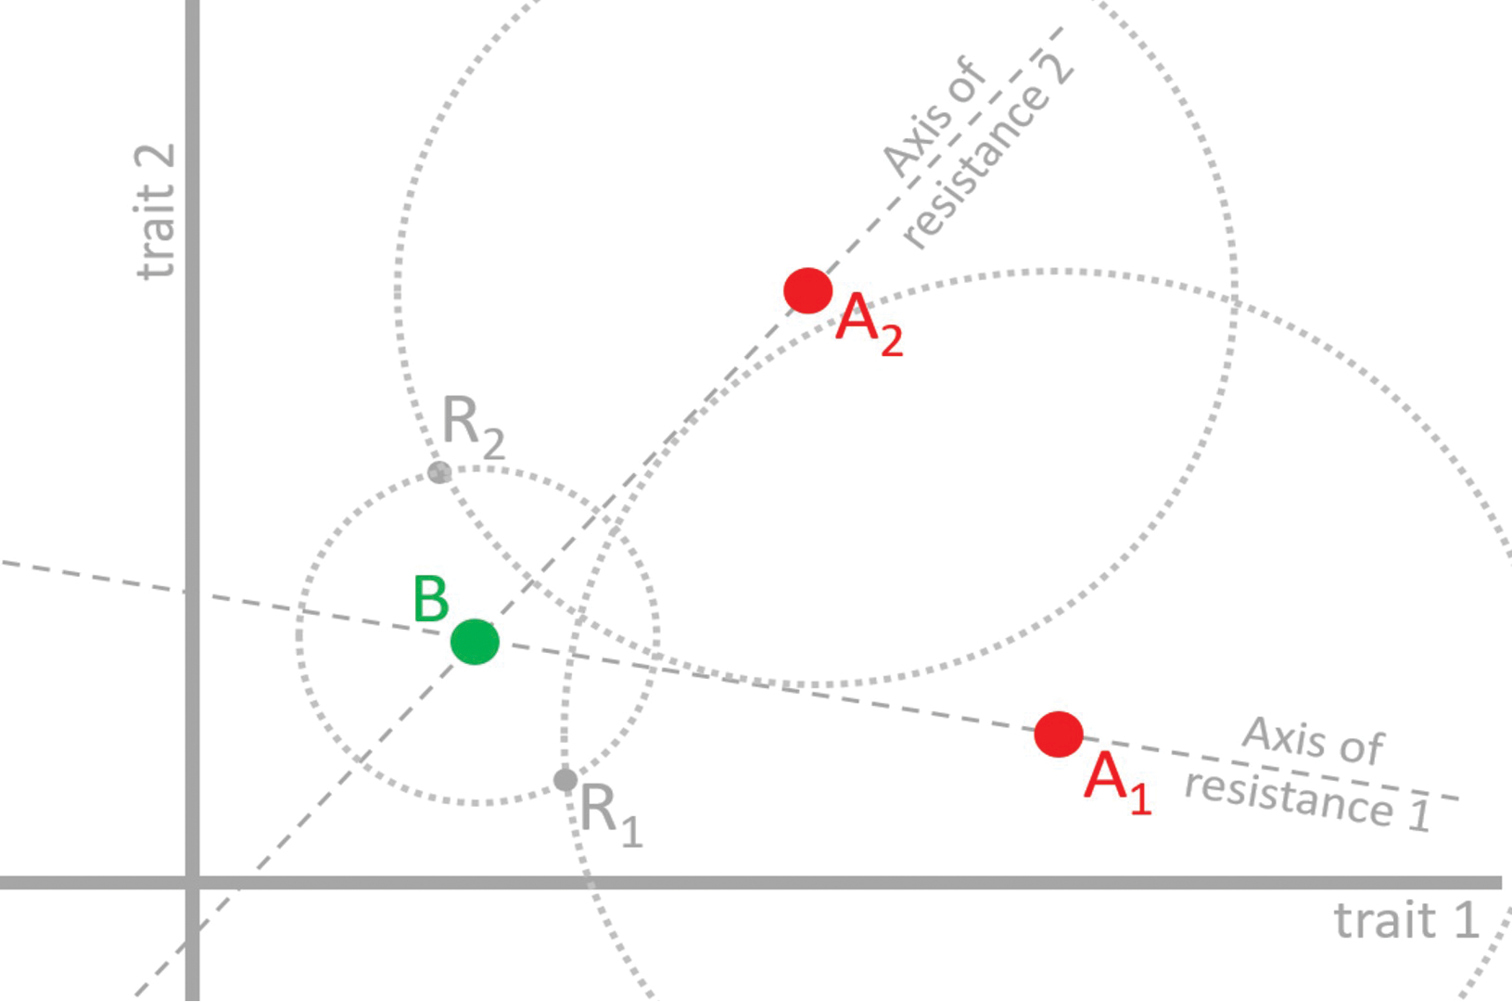
Sketch of a non-treated environment (phenotypic optimum in B) and two treated environments, with different doses of drug (optima A1 and A2). Two mutations are illustrated, with fitness effects compared to a wild type well adapted to the non-treated environment (i.e. located at B). Using the definition from Figure 3, R1 is a resistance mutation with respect to environment A1, but not with respect to environment A2, and reciprocally for mutation R2. Nevertheless, both mutations have the same cost. As with Figure 1 to 3, fitness depends on phenotypic distance and a mapping, which is not illustrated but would correspond to a third orthogonal axis. |