|
||
|
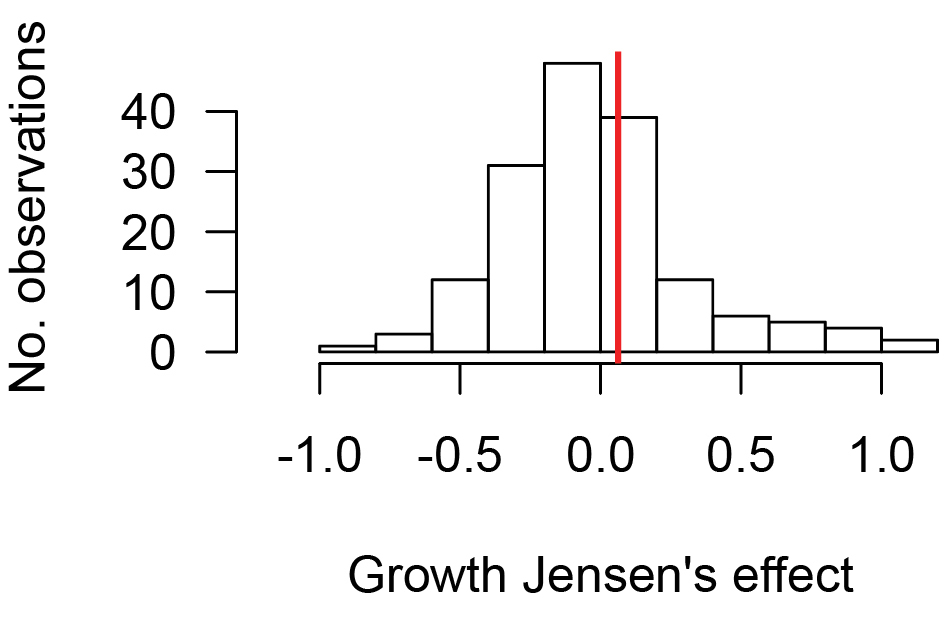
Frequency distribution of plant defense effect sizes. The vertical red line indicates the mean effect size calculated using a random effects meta-analysis model. |
|
||||||||
| Part of: Wetzel W, Kharouba H, Robinson M, Holyoak M, Karban R (2019) Plant trait covariance and nonlinear averaging: a reply to Koussoroplis et al. Rethinking Ecology 4: 115-118. https://doi.org/10.3897/rethinkingecology.4.32767 |