|
||
|
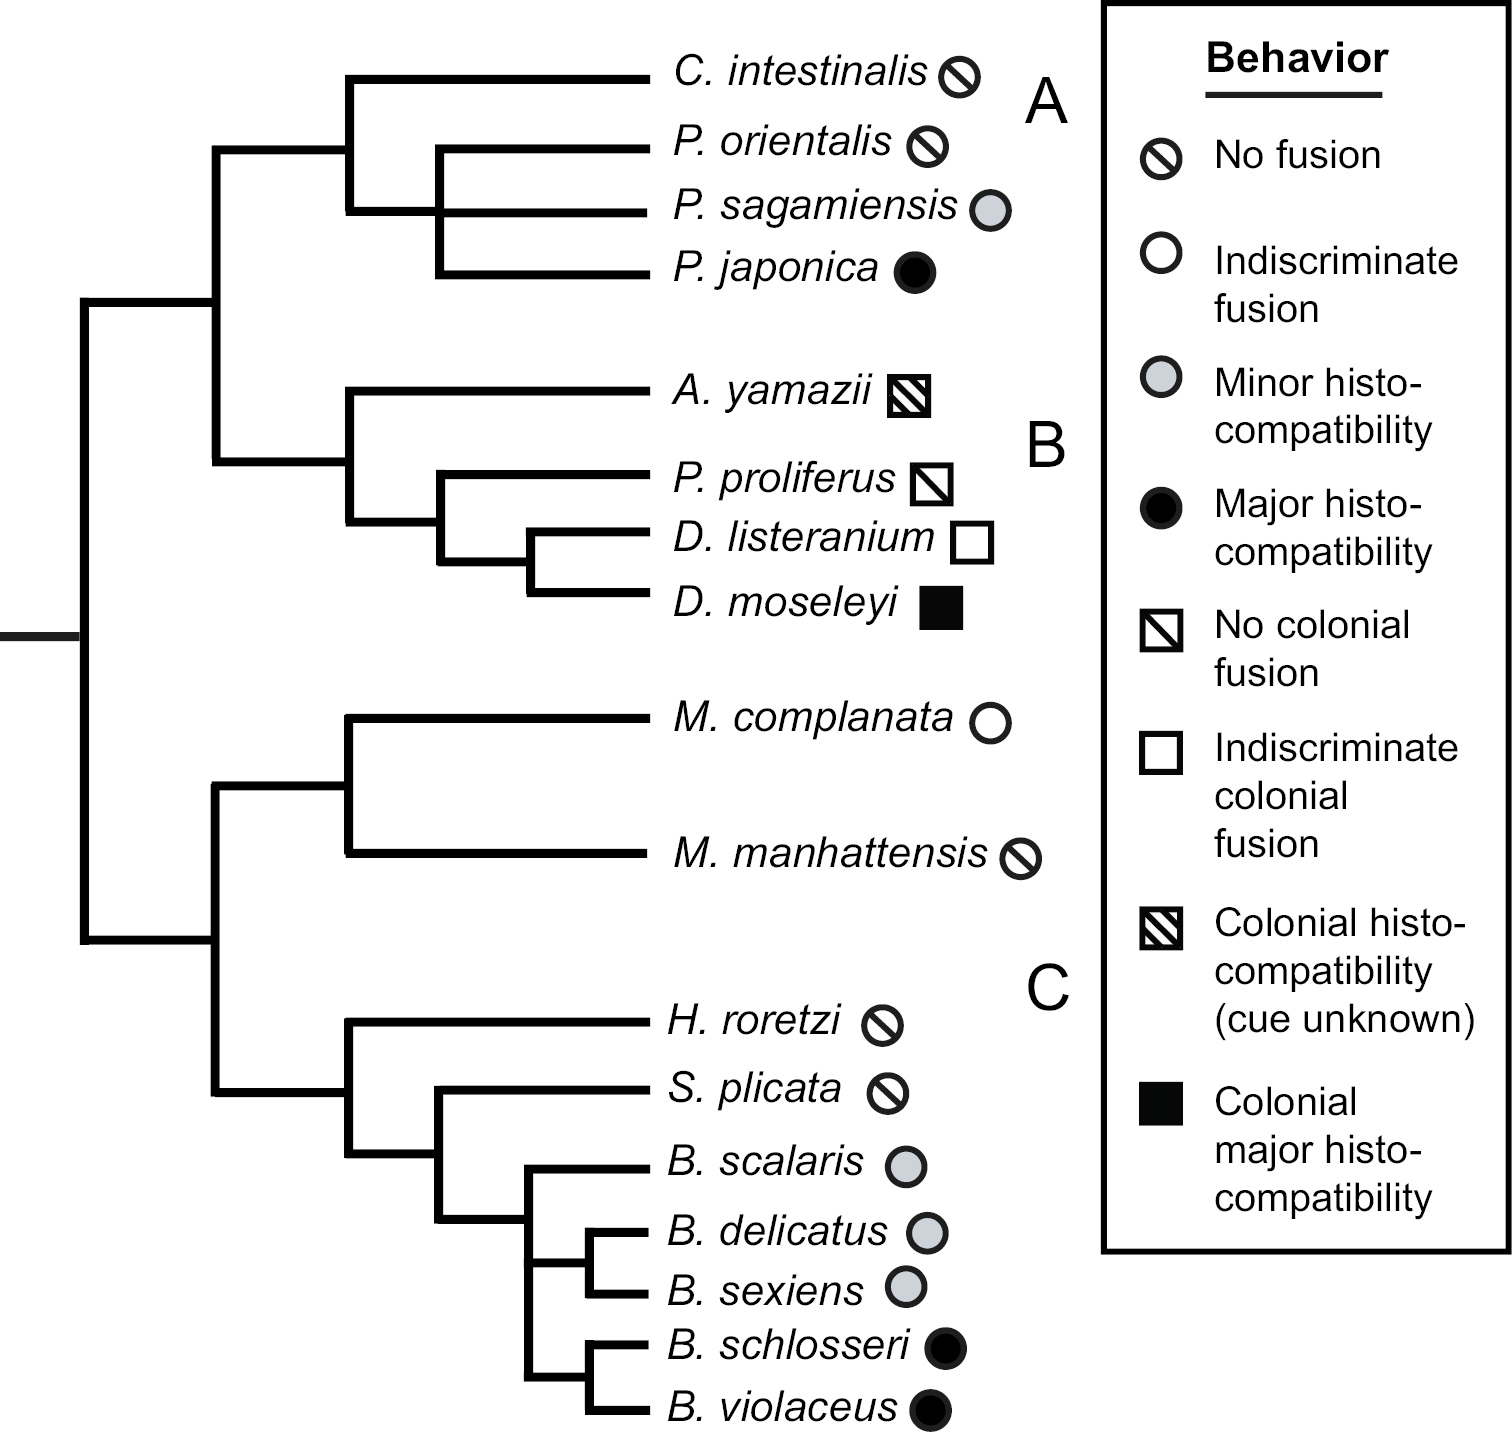
Cladogram of ascidians. This figure shows the transitional states predicted by Gilbert’s (2015) historical model (Fig. 6). Cladogram is organized by suborders A Phlebobranchia, B Aplousobranchia, C Stolidobranchia, and the form of histocompatibility (fusion-rejection) behavior employed (see Appendix for methods). |