|
||
|
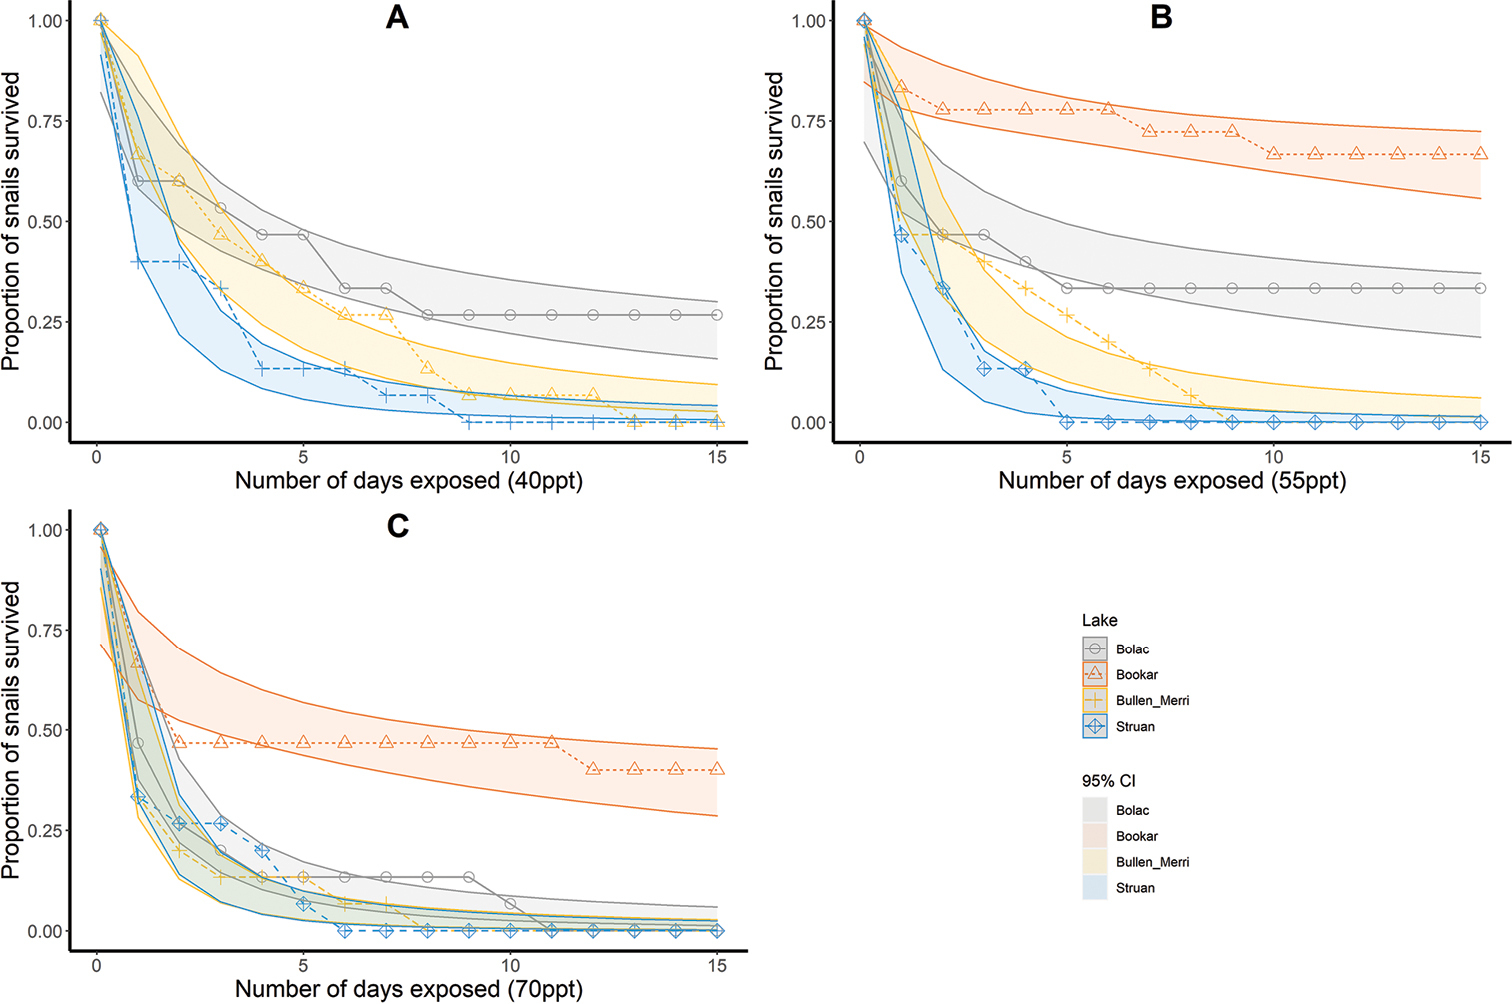
Survival rate plotted against days exposure to conditions of 40 ppt (A), 55 ppt (B), and 70 ppt (C) for populations of C. striata from each lake. Shaded areas are representative of a 95% confidence interval for proportion of living snails under each predicted mean. The D2 of the 40 ppt, 55 ppt, and 70 ppt models are 0.9115, 0.9165, and 0.9159 respectively. Additional statistics for each model can be found in Suppl. material 4. |